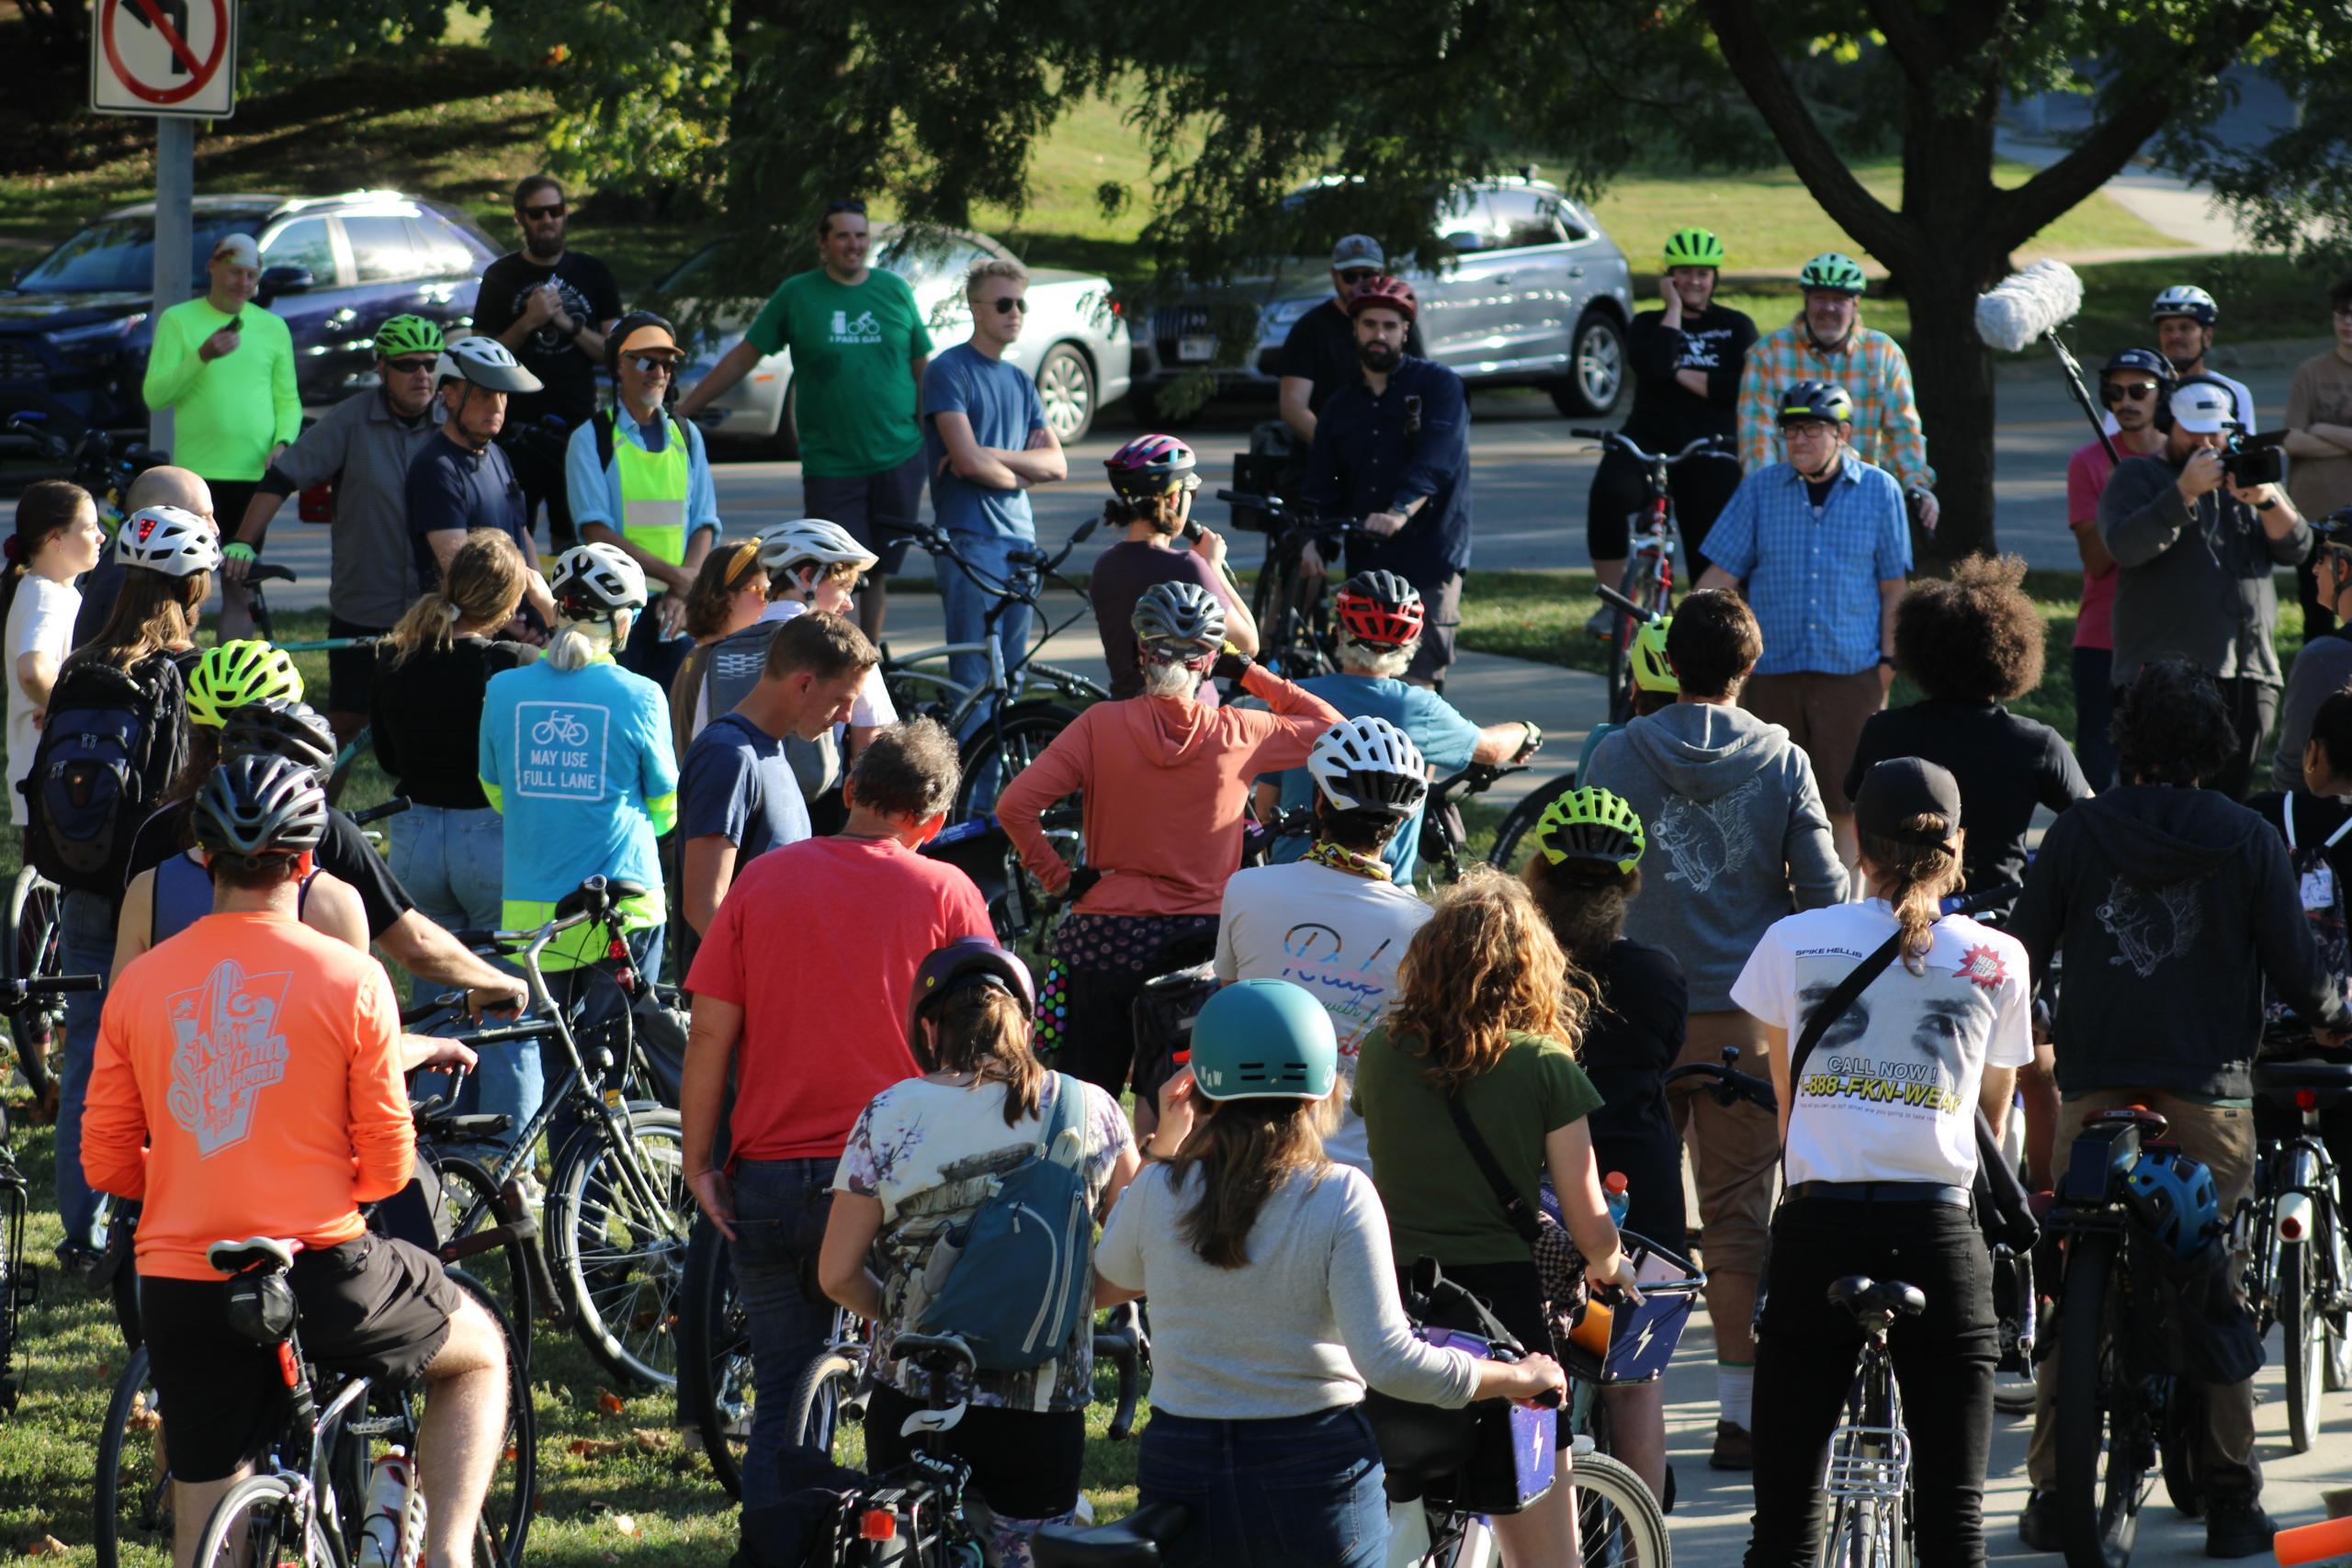
First and foremost, THANK YOU OMAHA!!! Because of your generosity on Giving Tuesday we surpassed our $6,000 goal and ended up at $7,638 in total donations!! Wow. We’re truly amazed and grateful for your support of our mobility equity work in the metro. With this year-end boost, we’ll head into 2022 strong, ready to continue the growth of our organization and to speak out about important transportation issues.
We celebrated last night with the premiere of a video project we call “Commute & Compare,” followed by a discussion about getting around Omaha with and without a car. If you missed it, you can find the film with Q&A on our YouTube channel here.

The concept for our experiment was simple: compare three trips from the Benson Library to City Hall using three different modes of transportation. The trips happened at the same time on the same day to ensure it was a fair experiment. Sarah rode her class 2 (pedal assist, not throttle) electric bike, Ky took the #4 Metro bus, and Stephanie drove her car.

Each person turned on a GPS tracking app so we could follow their trips and time spent. We were pleased to discover that the bus trip was only about 10 minutes behind the car. We also know that time shouldn’t be the only factor to consider when deciding the best mode for a trip. This is where the scorecard comes in!

We had each traveler tell us their favorite and least favorite parts of the trip and then filled in the scorecard accordingly. We ranked each mode 1-3 (1 being the best and 3 the worst) and then added up the results. After completing the scorecard, the bike received the least amount of points and is therefore the winner of this particular Commute & Compare.
This is a replicable experiment so if you’d like to try it, fill out the blank scorecard and let us know how it goes! You can also change the modes in case maybe a bike share option or scooter is plausible for your trip.

If you’d like to watch the film without the discussion, it’s available here! Click below and let us know what you think.
We hope that this is the first of multiple experiments and would love to hear your thoughts. We also hope it inspires you to shift your thinking and maybe event switch a trip from a car to another mode. As always, get in touch with us at info@modeshiftomaha.org.

